Q: Can I attach a debugger to the Home Server Console application to test my application?
A: Absolutely!
There are two ways of doing this... locally and remotely.
Locally works by installing a copy of Visual Studio (including Express) and setting it up similar to how we did with the Test Loader to launch the Home Server Console.
As well as this works, it's generally a less preferred option and it means that your testing environment has been contaminated by development tools and other libraries that *can* cause test results to differ from how they how code would perform in a clean environment.
A much less invasive method is remote debugging which involves executing a small debug monitor on the target machine which allows a developer to connect to the PC from their remote development environment, attach to a given process and step in and get a very similar debugging experience to what they have locally (except for Edit and Continue).
Remote debugging is truly ideal when coupled with Windows Home Server running in a Virtual PC so that only what is needed is deployed.
Software Requirements
In order to utilize remote debugging, we are going to need three key things:
- Visual Studio 2005/2008 Standard or higher
- Installed and running copy of Windows Home Server
- Remote Debugging Components
Configuration Notes
All of these instructions can be carried out on your running Home Server that is running on physical hardware or one running in Virtual PC 2007, it is highly suggested that you only do it on your Virtual PC copy in case issues should arise with the WHS environment that you wish to quickly eliminate.
For information on setting up Windows Home Server in Virtual PC, see last weeks tip: WHS Developer Tip #8: Virtual PC.
It is assumed for this post that you have a user account on the Home Server you'll be working with that has the same user name and password as what you are debugging with on your development machine.
Express Editions
Unfortunately the Express Editions of Visual Studio do not support remote debugging and to achieve similar effect to testing/debugging your add-in in the Home Server Console, it's easiest to simply install the Express Edition of your choice to your Home Server (preferably one running in Virtual PC). This too comes with some issues of its own.
I'll go into this in a special post tomorrow.
2005 vs 2008
The following instructions are written using Visual Studio 2005 (as I do not yet have a copy of Visual Studio 2008), however the process in the newer version should be virtually identical.
Remote Debugging Components
The first step in making your Home Server remotely debuggable is the installation of the Remote Debugging Components, a package that is unfortunately not downloadable from Microsoft (as far as I can determine), instead they are automatically installed to your development machine in this location:
Install path\Microsoft Visual Studio 8\Common7\IDE\Remote Debugger\x86
There is also an installer provided on the Visual Studio installation media. You can find this installer (named rdbgsetup.exe) in the Remote Debugger folder. Do note that because your Home Server runs on the x86 architecture, you'll want to use the x86 specific version of rdbgsetup.exe.
Once you have the Remote Debugging Components, simply copy them to your server either via a network share or a drag-and-drop to the VPC and install them (accepting all defaults) if you are using the rdbgsetup.exe installer.
Personally, I prefer the loose file option as they can be used without using any kind of installer and has a much lower installation footprint (ie none), further reducing the amount of contamination of the testing PC.
Elevating Permissions
While your add-in may not require it, the Windows Home Server Console must be run as Administrator and unfortunately the user account on your development machine does not easily have access to programs being run as the Administrator user on the Home Server Console.
To fix this, it is easiest to simply run the Home Server Console as your user account, but first we need to add it to the Administrators group, to do so:
Note that by adding your user to the Administrators group, you will no longer be able to remotely log into the Home Server via the web with it.
- Connect to your Windows Home Server via Remote Desktop and login as Administrator
- Click on the Start button
- Right click on My Computer and select Manage
- Expand Local Users and Groups
- Select Users
- Double click on your user account
- Select Member Of tab
- Click Add button
- Type Administrators into provided space and click OK
- Click OK to close your user account's properties
- Log out of Windows Home Server
Network Share
Because the building and testing of the add-in occur on different machines, its easiest to create a network share which points to where the add-in will need to be to be tested and copy the newly built add-in there each time, to create the network share:
- Connect to your Windows Home Server via Remote Desktop and login as Administrator
- Click on Start -> Run
- Enter the path: C:\Program Files\ and click OK
- Right click on the folder Windows Home Server and select Sharing and Security...
- Select Share this folder option
- Click Permissions button
- Click Add button
- Type your user name into the provided area and click the OK button
- Check under the Allow column, check the box that corresponds to the Full Control permission for your username
- Click OK button to close the permissions window
- Click OK button to close the folder properties
Running Remote Debugging Components
Depending on how you have deployed the Remote Debugging Components, you will launch them in different ways.
If you used the installer from Visual Studio 2005:
- Select Start -> All Programs -> Microsoft Visual Studio 2005 -> Visual Studio Tools -> Visual Studio 2005 Remote Debugger
If you used the installer from Visual Studio 2008:
- Select Start -> All Programs -> Microsoft Visual Studio 2008 -> Visual Studio Tools -> Visual Studio 2008 Remote Debugger
If you copied the directory containing the files:
- Navigate to the directory where you copied the debugging tools and execute msvsmon.exe
When first launched the Visual Studio Remote Debugging Monitor (if run directly from the copied folder) will prompt you as to what exclusions to the firewall do you want to add, select Unblock remote Debugging from computers on the local network (subnet) if you know your test Home Server is on the same subnet, otherwise select Unblock remote debugging from any computer and click OK.
When launched you'll be greeted with a new window like this which you can minimize, first though note the message that is displayed:
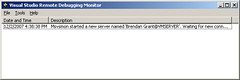
You will need to use the server name specified again later in the next section.
Configuring Visual Studio
Now that your Home Server is configured for remote debugging,
- Launch Visual Studio 2005
- Open desired project
- Right click on Project in Solution Explorer and select Properties
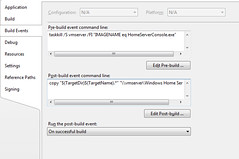
- Select Build Events tab
- Enter the following for the Pre-build command line
taskkill /S servername /FI "IMAGENAME eq HomeServerConsole.exe"
- Enter the following for the Post-build event command line
copy "$(TargetDir)$(TargetName).*" \\servername\Windows Home Server\
In both cases you will need to replace servername with the name of the Home Server you will be debugging.
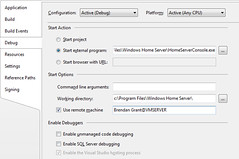
- Select Debug tab
- Check Use remote machine option and enter server name that was noted when running the Visual Studio Remote Debugging Monitor on the server (based on username@servername format)
- Check Start external program and enter the following path:
c:\Program Files\Windows Home Server\HomeServerConsole.exe
- Specify the following for the Working directory:
c:\Program Files\Windows Home Server\
In the end you should have a couple of pages that look something like this:
Build Events:
Debug:
Firewall
In order to make one of our Visual Studio changes actually work, we either need to poke a hole in our Home Server's firewall or disable it all together, hopefully we are doing this work in a VPC so lets just disable it, to do so:
- Select Start -> Control Panel -> Windows Firewall
- Check Off option and click OK button
What we have done
The Visual Studio project has now been configured to kill the Home Server Console every time your the project is built, copy the updated assembly and debug database (pdb) to the Home Server if the build succeeds, and if you do elect, launch the Home Server Console again on the Home Server and attach the debugger.
Using it
At this point, 4 options exist for testing our add-in that has been deployed to our test Home Server on every successful build:
1. Manual running of the Home Server Console - At any time you are free to double click on the Windows Home Server Console icon on your test machine's desktop to load the Console normally.
2. Launching from Visual Studio - By pressing the Control+F5 keystroke or using the Debug -> Start Without Debugging menu option to rebuild your project and launch the Home Server Console without debugging.
3. Immediate debugging from Visual Studio - Using the F5 keystroke, the Debug -> Start Debugging menu option, or everyone's favorite green triangle, the project will be rebuilt, launch the Home Server Console and attach to it, allowing you to step through code and examine the running state of the add-in.
One problem that is not uncommon using this method is unhanded exceptions like this one which often occurs for me when opening the Settings dialog:
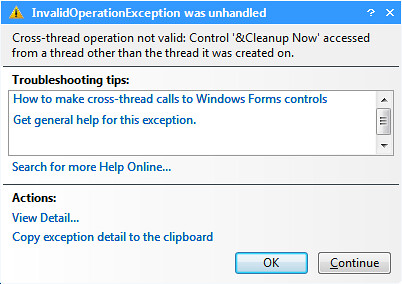
Ordinarily we might tell Visual Studio to not break when this kind of exception occurs... instead we should try to use the debugger as a more limited tool... only when we need it, which is what we do in option #4:
4. Delayed debugging - Rather than immediately debugging our add-in, we can use option #2 to launch it and get things running normally... and then when we want to attach the debugger to check something, we can use the Debug -> Attach to Process menu option or the Control+Shift+P keystroke to display the Attach to Process dialog:
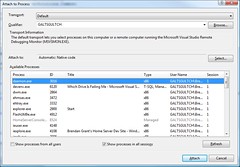
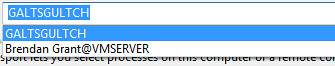
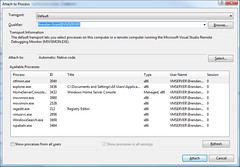
From here, you'll need to change the Qualifier to the Debug Monitor server session on your test Home Server, which should be available in the drop down list because of your specifying it when configuring Visual Studio.
Once the proper process list is selected, simply double click on the HomeServerConsole.exe (or single click and click Attach button) to attach the debugger.
Now... simply wait for break points you've already set to be reached... or set new ones.
Conclusion
When coupled with Virtual PC, Visual Studio 2005 and 2008 can easily attach to the Windows Home Server Console running on a remote machine, allowing a developer to examine the inner workings of their running add-in to better troubleshoot it.
Next Time
Tomorrow I will post about how you can install a copy of Visual Studio Express on your Home Server (running in a Virtual PC) to do local debugging.
Note: The information in this post is based on undocumented and at times deduced information on Windows Home Server and is not officially supported or endorsed by Microsoft and could very easily be wrong or subject to change in future, so please take it and everything else said on this blog with a grain of salt and use with caution.
Read the complete post at http://feeds.feedburner.com/~r/IHateLinux/~3/198078214/whs-developer-tip-9-debugging-part-1.html